Field story 02 · land records · continues the flood story
Whose Land Flooded? Cadastral Records as Arrays
After the water recedes, the question that decides who gets compensated is a land-records question: which parcels were in the flood, in which villages. We answered it from the raw 11.2-million-parcel Bihar cadastral dump — and then measured something officials whisper about but rarely quantify: how far the cadastral map itself is shifted from reality.
The compensation list, from raw data
Why this matters
Flood compensation in Bihar runs village by village, parcel by parcel. Producing the list normally means weeks of field verification. We had the flood mask from the One Flood story and a public scrape of the state's cadastral records: 11.2 million parcel polygons in one 1.9 GB file. The question "whose land is under water" became a matter of reading the right slice of that file.
What came back
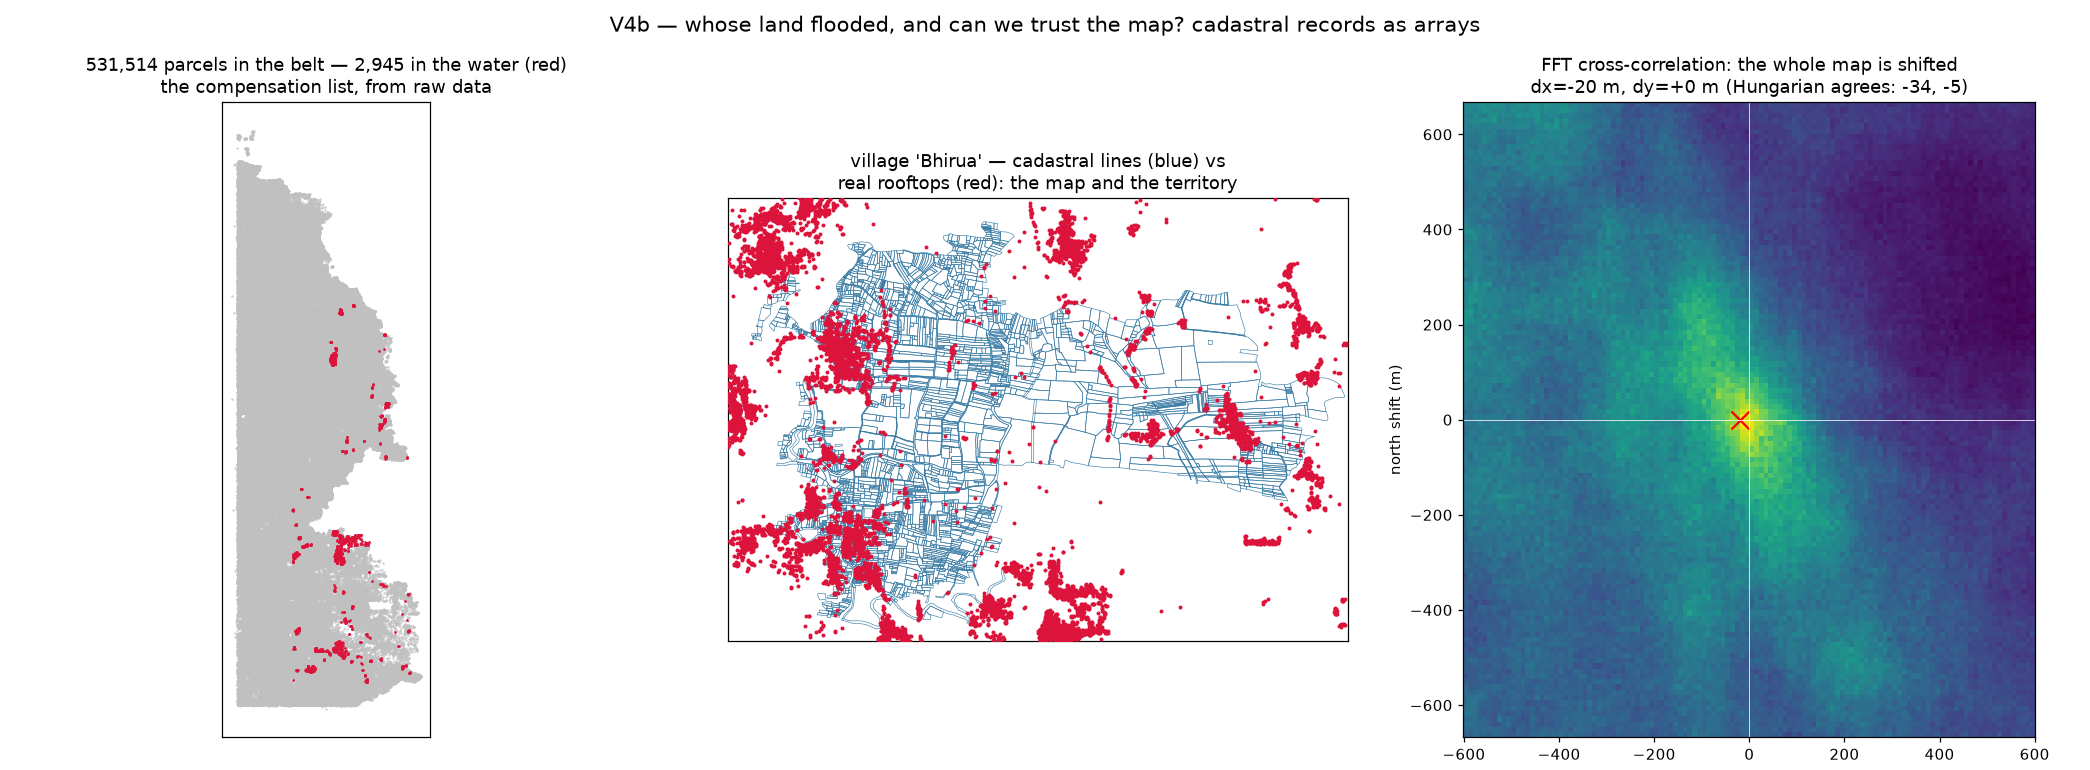
- 531,514 parcels loaded for the flooded belt — pruned from 11.2M without reading the rest, because the file stores a bounding box per row group.
- 2,945 parcels with their centre in the new water.
- A ready-to-print village ranking: Bhirua (836), Sughrain (367), Aadharpur (288)…
How it works — and what the data confessed
Parquet files remember the range of every column in every chunk, so we skipped straight to the chunks whose bounding boxes touch the flood area. Each parcel's centre then asks the flood grid the same one-array-lookup question the buildings asked. The confessions: this scrape covers only four districts, some source files carry broken coordinates, and the area column is empty for whole districts. Real cadastral data is like this. A pipeline that doesn't say so out loud is lying by omission.
The compensation list took one script. The caveats took three sentences. Both belong in the report.
hit = (bbox.xmax >= west) & (bbox.xmin <= east) & ...   # prune 11.2M -> 531k
parcels = from_wkb(table["geometry"])                    # shapely, vectorized
flooded = flood[row_of(centroids), col_of(centroids)]    # the list
Can we trust the map? (measuring the shift)
Why this matters
Everyone who has overlaid Indian cadastral maps on satellite imagery knows the uncomfortable truth: the map is often shifted — scanned from cloth or paper decades ago, georeferenced approximately. If you pay compensation off a shifted map, you pay the wrong neighbour. So before trusting our list, we measured the shift for the worst-hit village.
Two independent answers that agree
- FFT cross-correlation slides the parcel map over the real-rooftop map at every possible offset at once and finds the best fit: shifted 20 m west.
- Hungarian assignment pairs individual buildings with individual parcels and takes the median displacement: 34 m west.
- Different mathematics, same verdict. That agreement is the audit.
How it works
Rasterize both point sets — parcel centres and real rooftops — onto a 10 m grid. Cross-correlating two grids sounds expensive; the FFT does every offset simultaneously in a blink. The peak of the correlation surface IS the shift. The Hungarian algorithm then cross-examines the same question from the individual-pair side.
The map and the territory disagree by a measurable vector. Measure it, publish it, and only then use the map.
corr = fftconvolve(rooftop_grid, parcel_grid[::-1, ::-1])  # all offsets at once
dy, dx = np.unravel_index(corr.argmax(), corr.shape)        # the shift
rows, cols = linear_sum_assignment(pairwise_distances)      # the cross-check
What it means
Cadastral matching sounds like a niche GIS specialty. Underneath it is signal processing and an assignment problem — tools every scientific-computing person already has. The land record is an array. Treat it like one, audit it like one.