Field story 03 · urban expansion · Patna 2018 → 2026
Which Way Is Patna Growing?
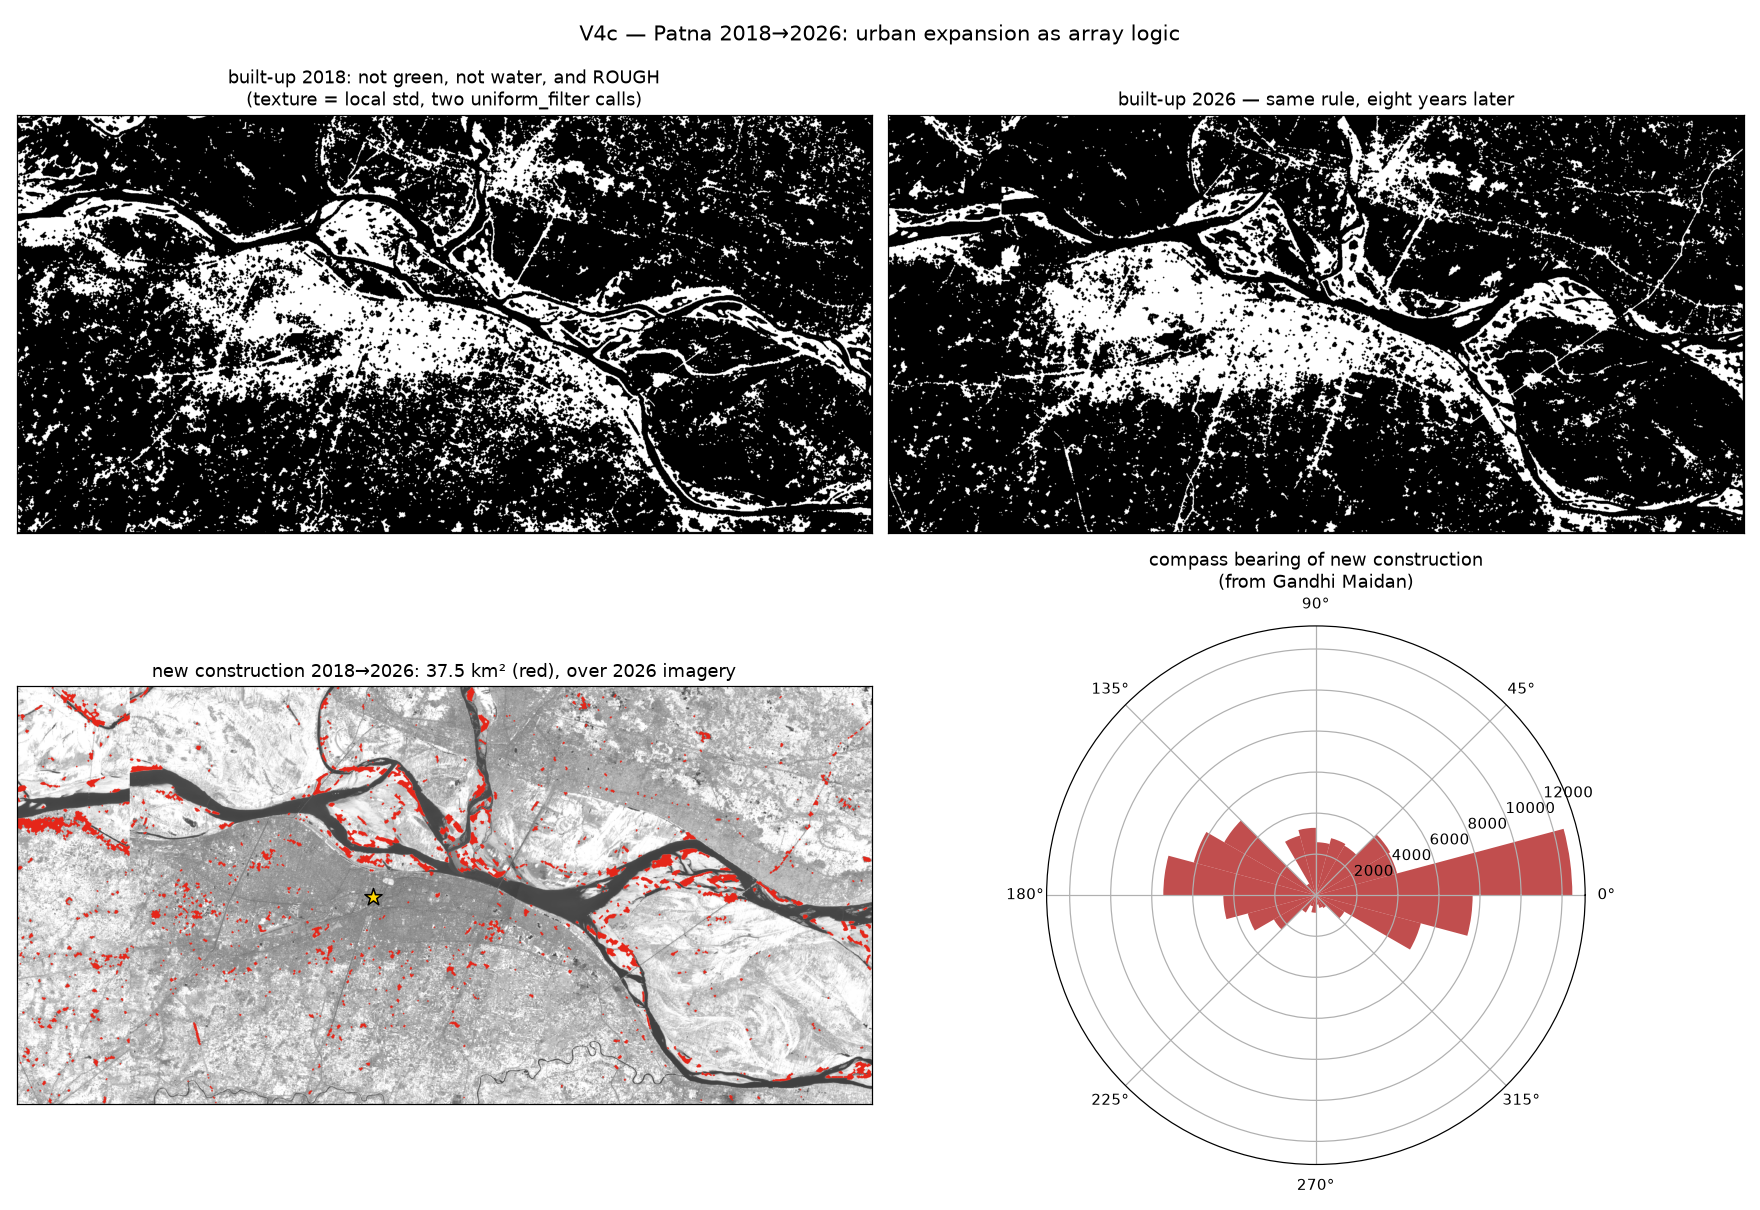
Take two cloud-free satellite mosaics of Patna, eight years apart. Ask three questions of every pixel: is it green, is it wet, is it ROUGH? What's left is the city — and subtracting the two city-masks reveals 37.5 square kilometres of new construction and the compass direction it marched in.
Growth as array logic (and why the naive rule failed)
Why this matters
Master plans, property markets, flood-risk zoning — all of them depend on knowing where a city actually grew, not where paperwork says it did. Commercial "urban growth" products are black boxes. This is the transparent version: every rule visible, every threshold arguable, running on free imagery of one of India's fastest-growing state capitals.
The failure worth keeping
The textbook "built-up index" (comparing shortwave and near infrared)
classified the Ganga's sandbars as concrete — spectrally,
dry sand and cement are cousins. The fix came from a different intuition:
cities are rough. At 20 m resolution, urban fabric flickers
pixel to pixel; sand and fallow fields are smooth. Roughness is a rolling
standard deviation, built from two calls to uniform_filter.
How it works
Built-up = not vegetated (NDVI low) AND not water (NDWI low) AND textured. Run the same rule on 2018 and 2026 mosaics, subtract, clean with morphology. Then geometry does the interpretation: each new-construction pixel has a bearing and distance from Gandhi Maidan, so a polar histogram shows the direction of growth and a median gives its distance from the centre.
The city turned out to be growing east and west along the Ganga corridor, a median 13 km from the centre. The rose diagram is the kind of figure a planning department argues about for an hour — which is exactly what a good figure is for.
texture = sqrt(uniform_filter(nir**2, 7) - uniform_filter(nir, 7)**2)
built  = (ndvi < 0.35) & (ndwi < 0) & (texture > 0.06)
growth = built_2026 & ~binary_dilation(built_2018)
What it means
Change detection is subtraction plus honesty about your rule's blind spots. Some of the red near the river is shifting sandbars, not buildings — we say so, because a rule you can read is a rule you can criticise, and that is the entire advantage over the black box.